Blog
About us
Contact
Blog
Filter
AI
Best Practice
Business Case
Culture
Data Engineering
Data Visualization
DevOps
Election Forecast
LLMs
Machine Learning
Online Marketing
Project Management
Python
R
Reporting
Shiny
Software Development
Statistics
Statistik
White Paper
2021-03-15
by Ulrich Rendtel
The Representation of Corona Incidence Figures in Space and Time
2021-02-20
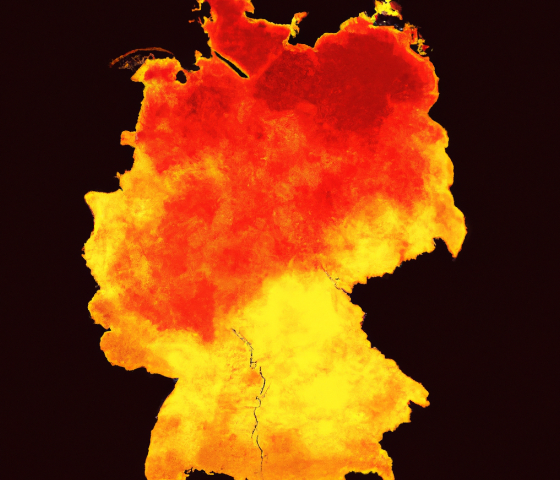
by Marcus Groß
COVID-19: Heat Map of Local 7-day Incidences over Time
2019-12-23
by Michelle Golchert
Data Visualization in R vs. Python
2018-03-05
by Sebastian Warnholz
smoothScatter with ggplot2
2017-12-12
by Sebastian Warnholz
A Not So Simple Bar Plot Example Using ggplot2
2017-11-02
by Marcus Groß
Business Case: Spatial Data Visualization