shinyMatrix - Matrix Input for Shiny Apps
shinyMatrix - Matrix Input for Shiny Apps
In this post we’d like to introduce you to our new R package shinyMatrix. It provides you with an editable matrix input field for shiny apps.
Use Cases for Matrices in Shiny
We have been developing shiny apps for quite some years now. A problem we stumbled upon multiple times in this process was, that there is no easy approach to define matrices in shiny. So we had to help ourselves with workarounds. The use cases for matrices are obvious, though:
- Definition of covariance matrices
- Entry or modification of smaller data sets by hand
- Define contrasts for a statistical model
- etc.
Alternatives to shinyMatrix
As mentioned we had to find some workarounds in the beginning. Either one could define a text field (textAreaInput), which then can be transformed into a matrix. Or one could create multiple input fields dynamically in R via renderUI and bring these fields together afterwards. It’s laborious, but it works. The package DT offers the possibility to edit cells in a data frame. But to use this to input a complete matrix, it is laborious too, and second one has to implement the changes to the data set also on the server side. That’s what drove us to build a package for easy matrix input in shiny.
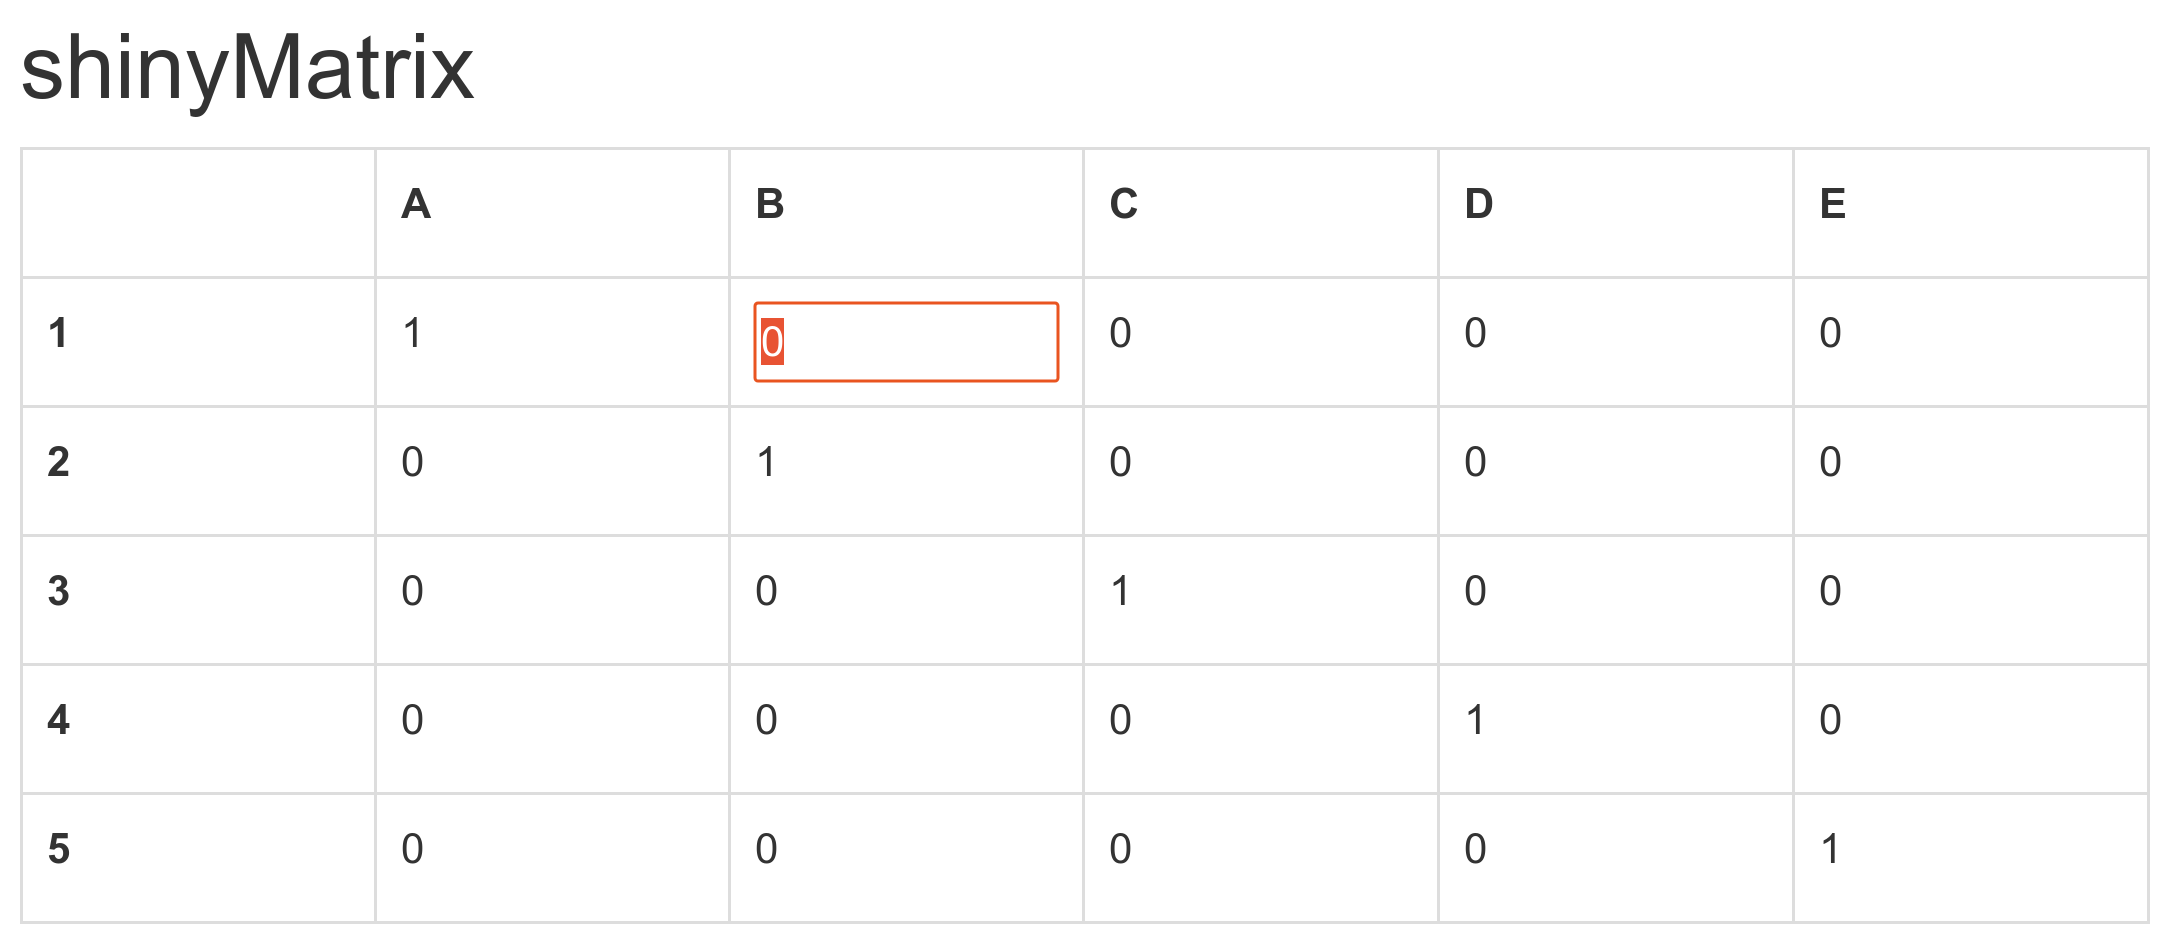
shinyMatrix Features
The current version 0.3.0 of shinyMatrix on CRAN comes with the following features:
- ui function to define a
matrixInputfield - use the matrix via
input$elementId- hence no transformation, parsing, etc. needed - copy’n’paste: within the app and between the app and a table calculation program
- usage of “tab” and “enter” in order to jump from one matrix cell to another
- automatic size adjustment of the matrix
- editable matrix row and column names
- serverside update of matrix via
updateMatrixInput - automatic transformation of the matrix into the correct class (currently “character” and “numeric” are implemented
Usage
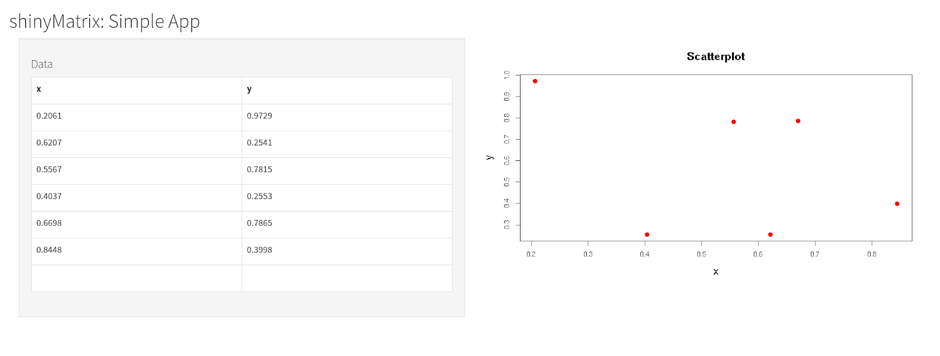
We created a very simple example app to demonstrate the shinyMatrix package. Follow https://inwtlab.shinyapps.io/shinyMatrixSimple/ to see the app in action.
For reasons of simplicity we use a single file app.R for the app. It contains as always a server and an ui function (if you’re not yet familiar with shiny apps at all, you’ll find an introduction to shiny on the RStudio website).
## app.R

library("shiny")
library("shinyMatrix")

m <- matrix(runif(12), 6, 2, dimnames = list(NULL, c("x", "y")))

ui <- fluidPage(
  titlePanel("shinyMatrix: Simple App"),
  sidebarPanel(
    width = 6,
    tags$h4("Data"),
    matrixInput(
      "sample",
      value = m,
      rows = list(
        extend = TRUE
      ),
      cols = list(
        names = TRUE
      )
    )
  ),
  mainPanel(
    width = 6,
    plotOutput("scatter")
  )
)

server <- function(input, output, session) {
  output$scatter <- renderPlot({

    plot(input$sample, col = "red", main = "Scatterplot")
  })
}

shinyApp(ui, server)
Via the parameters of the matrixInput function one can configure the input field. In this example we use:
sample: ID of the input fieldvalue: initial matrix (optional)rows.extend: add rows automatically (optional)cols.names: show column names (optional)
The complete technical documentation, further examples and new unreleased versions can be found on GitHub. Feel free to help improve this package! For bug reports and feature requests please open a new issue.