Reflecting on 2020 US Election Forecasts: 10 Takeaways for Data Scientists
The 2020 US Presidential election past November has been the prime political event of this past year. Political scientists and data scientists had the opportunity to develop forecasting tools to understand and predict American voter behavior, despite the political upheaval and rising discontent in a bipolarizing US political ecosystem. The discourses and literature concerning the right way to forecast the American election are still being hotly debated. When reflecting on The Economist forecasting methodology compared to Nate Silver’s FiveThirtyEight forecasting model, there are 10 takeaways to keep in mind for every data scientist.
1. Questioning the predictive power of fundamental economic factors
One school of thought claims that fundamental-based features (economic features like stock markets, GDP, etc.) are good predictors of voter behavior once they combine these information with their partisan leanings. G. Elliot Morris from The Economist argued that fundamental-based forecasts can be more consistent and stable. The Economist team believes that the results are far from perfect, but are impressively reliable in historical back-testing. On the contrary, some argue that these predictors tend to overfit the model because they are too close to the historical data. Data science expert, Marcus Groß from the Berlin-based INWT-Statistics, also shares the same concern, asking “whether economic data is implicitly baked into the poll data” thus providing redundant economic information for the model to train on. In addition, the FiveThirtyEight model, the leading political polling forecaster, used Bayesian models that heavily depend on polling data tuning on three types of recalibration to account for voter behavior nuances: 1) likely voter adjustment, 2) house effects adjustments, and 3) timeline-stimulants adjustments e.g. political debates.
2. Weighing economic data depends on how we perceive the trade-off between political polarization and economic-trade confusion
The Economist claims one should include economic data when incumbents were running for re-election as the impact of economic success of a term could influence voter preference significantly. FiveThirtyEight found that the “economy explains only around 30 percent of the variation in the incumbent party’s performance, meaning that other factors explain the other 70 percent.” This finding perhaps hints that term-limited presidents do not bequeath their economic legacies to their parties’ heirs. Moreover, the finding that – “the magnitude of this effect has shrunk in recent years because the electorate has become more polarized” – is debatable considering how the US-China trade war has also impacted many Americans’ perspective in the recent years. The claim that there are fewer “swing voters,” whose decisions are determined by economic conditions, also remain questionable because of the recent trade tensions. How much should we weigh economic data depends on how we perceive the effects of the trade-off between the polarization of electorate and current geopolitical trade tensions.
3. Polls initially are weak, but are strong predictors as election day approaches
Data scientists should understand the limitations of poll data. Given that polls in a democratic election capture the citizens' voting choices, data scientists recently have used this data in creative ways to conduct feature engineering. Because we understand the influence of the central limit theorem, polls during its initial publications provide premature information in predicting the final outcome of the election. The Economist forecasting team warns that early poll statistics could inevitably provide polling biases and errors. On the other hand, data scientist Marcus Groß at INWT-Statistics says that “early polls do not include impactful events between the poll date and election date and later polls are just more precise when approaching the election day”, meaning that they could underestimate uncertainty but also do not account for future events.
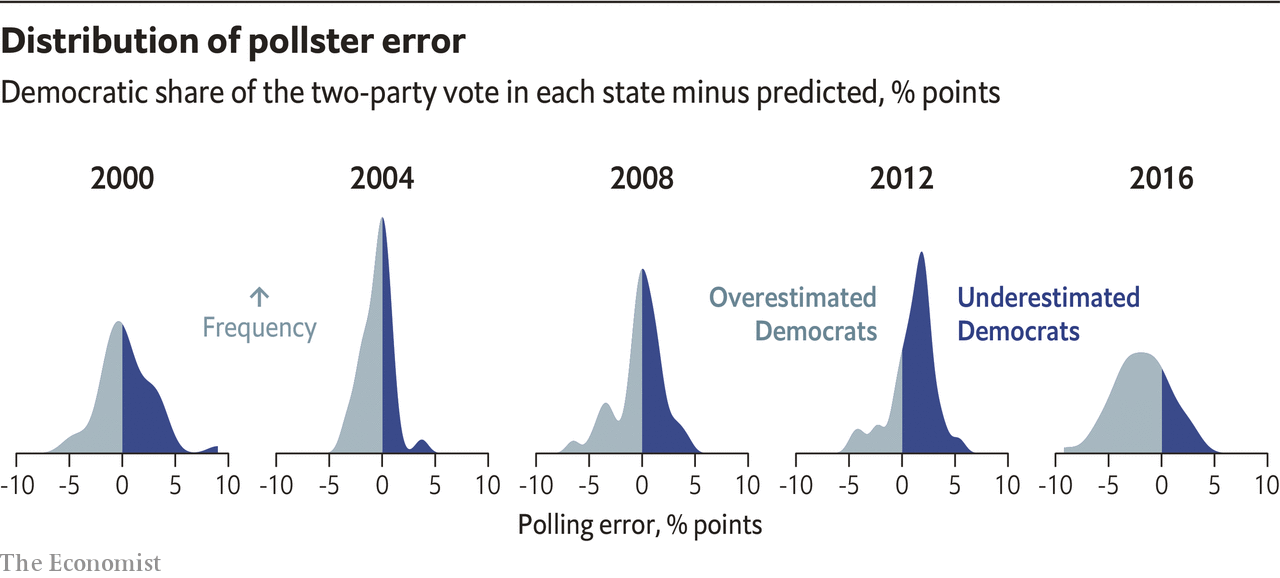
Source: The Economist - How The Economist presidential forecast works
4. Polling averages are snapshots, not a forecast
The FiveThirtyEight model aggregated the polling in each state to reflect the current status of the election. Recommended tips to treat polls data properly include — be cautious of fake polls, avoid polls commissioned by nonprofessional hobbyists online, avoid polls that blend or smooth their data using multiple regression with postratification (MRP) from third-parties, and exclude polls that consider test hypothetical candidates. Once we have our reliable polling data, we can decide using 2 general methods of averaging the polls: 1) take a simple average of recent polls or 2) an ensemble method that combines the polls into trendlines. The FiveThirtyEight model used a hybrid of both. The main idea to take away is that polls provide a so-called “Now-cast” instead of “Forecast” because it invites questions like “what if the election were today instead of in November”, says Marcus Groß.
5. Increasing polarization of the American political ecosystem may impact the model predictions
Political polarization hinders the efficacy of policy implementations. Over the years, the polarization in the US government between the parties have increased. One method to model polarization is to breakdown the institutional mechanisms of the US Government. Metrics to consider include difference of means in party seats, proportion of seats in moderate Democrats vs Republicans, number of seats associated with the Chamber, and difference of means in regional democratic vs republican seats. This could lead to less uncertainty if we hold some democratic variables constant. Other ways to model the political polarization include using what Poole and Rosenthal called "DW-Nominate Scores", a method that takes into consideration multiple dimensions of polarization in the House and Senate seats.
6. Cross validation on each election year is the way to go
Data scientists have long used cross-validation to prevent model overfitting, but for this election prediction we should consider more innovative ways to deploy cross-validation. The Economist predictive model used the “elasticity net regularization” and “leave-one-out cross-validation” techniques, which specify each fold as one election year’s data. Using fundamental data dating back from 1948, they built a model that trains on a 17-fold cross-validation method, each fold representing each of the presidential elections dating from 1948. Subsequently, the model holds out the data from each election and uses it to predict results of the holdout sample year in the upcoming election. For tuning the model, there were in total 18 forecast predictions for each presidential year, finally optimizing the amount of shrinkage to choose the model that rendered the best results from the holdout election data.
7. Uncertainty of COVID-19 on voters’ choice is difficult to quantify
History doesn’t repeat itself, but it sometimes rhymes. There are methodologies to quantify how pandemics impact voter choices in history, but the impacts of COVID-19 on citizens’ political leaning, economic outlook, and state-level decision-making are still unclear. The Economist model has taken into account the economic recession caused by COVID-19 pandemic then adjusted their economic index accordingly to the limits of the data on which the model was trained. On the other hand, the FiveThirtyEight model has scrutinized two COVID-19 related variables for feature engineering: 1) economic uncertainty 2) overall volume of COVID-19 related news. In addition, 538 allowed COVID-19 be a predictor that determined a covariance score by factoring in states that have high rates of COVID deaths.
8. Modeling the Swing States’ voting behavior is not an easy feat
Predicting state partisan leaning is key in understanding the American political system. Unlike France and Germany’s proportional system or other EU election systems, the US employs “The winner-takes-all” which gives forecasters clues to breakdown each state by a political “partisan leaning” – the degree of each state’s preference for democrats or republicans compared to the average American preference to quantify the ‘swingness’ of each state. Subsequently, the calculation of the probability of each candidate winning a vote is turned into the political leaning score. FiveThirtyEight uses a “swing elasticity” score index to reflect the expected change of a state based on changes on the national level. The modeling of the “uniform swing” portrays the relations between the variation of candidates national popularity and the each states’ ability to respond to change in popularity.
9. Mix-model approach of using polls data and fundamental data could be one solution
Recent elections show that poll data has become more accurate in representing people’s voting choices. The Economist model supports this trend by allocating less weight on the fundamental data and more weight on the national poll data as the election date approaches. Regardless whether the candidate is incumbent or how much economics influence election outcomes, it is up to the judgment of the data scientist to include fundamental data, poll data, or both. The predictive power of both types of data sources could possibly ensemble a model that could predict the best results. The FiveThirtyEight team has also combined both data sources by averaging the polling estimates based on demographics and past voting patterns. Next, the model considers the priors from fundamental economic data (jobs, spending of households, income, manufacturing, inflation, and stock markets), as well as demographic data (religiosity, race, income, education, urbanization) to produce a forecast of the Election outcome. Combining a form of partisan lean index, demographic regression modeling, and regional regression analysis (Northeast, Midwest, South, West), the FiveThirtyEight model takes into consideration a complex set of variables and adjustments for this year’s election. Lastly, each time the model is updated, about 40,000 simulations were performed, analyzing these characteristics: religion, state’s partisan lean, latitude & longitude, region, urban/rural, median income, age, gender, education, and immigration. Whereas The Economist heavily depended on fundamental data from the initial phases of the election then slowly putting more weight from the poll data as the election day approaches, the FiveThirtyEight model has consistently put a heavier emphasis on poll data from the very start.
10. Knowing what types of uncertainty contribute to which types of errors is critical for forecast accuracy
Nate Silver of FiveThirtyEight’s model specifically take into account four types of uncertainty that could increase prediction error rate: National Drift (difference in expected and actual between the snapshot moment and on Election day), National Election Day Error (final forecast comparing to actual results), Correlated State Error (error that could occur across multiple states along geographic or regional domains), and State-specific Error (forecast accuracy concerning to each state). Similarly, In the 2017 German Election forecasting, our inhouse INWT-Statistics election forecast model also tracked many types of uncertainties. For example, the single-poll uncertainty, overall poll uncertainty, uncertainty due to future events, and pollster house-biases. Election forecasters going forward should not just copy and paste the US Election model to their home democracies, but instead also think of creative ways to engineer new methods to quantify the uncertainties associated with the nuances of their own political systems.
In conclusion, these takeaways can be transferable to other democracies’ upcoming elections. With the German Bundestagswahl elections approaching in September 2021, Marcus Groß also suggests the difficulty for Germany to implement a mix-model approach because of fewer data points available (less regional level data, less old poll data), structural break in German Unification, more complex dynamics due to multi-party system. In addition, Groß suggests that we use a Long-short-term voter memory approach as an alternative to the mix-model approach for the US election because it provides other methods of quantifying uncertainty. In the end, it is ultimately up to the data scientist to rethink innovatively on how they apply these models to their own national elections. The biggest takeaway is that statisticians and data scientists should be cautiously aware of subtle differences and political structural nuances that could add complexities and uncertainties to their forecasts.