Automated Excel Reports with Python
In this article you will learn how to get data from Python into an Excel file and add some formatting. Excel reports are a great way to communicate data or results, especially to people who don't use Python. Another great advantage is that you can create automated reports: You define once what the reports should look like, and then you can create it very quickly for, for example, different subgroups of data, or data that is updated regularly.
The first part of the article describes the most important functions and actions, for example, setting column widths, changing font colors, or adding hyperlinks to other sheets. In the second part, all of these features are combined in one Excel file.
If you're looking for a template for python to excel reporting, take a look at our public GitHub repository python-excel-report.
Basics
In this section, you will learn how to write a pandas data frame to an Excel file, change the sheet name and adapt column widths.
Let's start with a very simple example. We create a small pandas data frame with companies' stock prices which we will write directly to an Excel file.
import pandas as pd

data = pd.DataFrame({
    "id": [14, 82, 5],
    "name": ["Cookie Corp.", "Chocolate Inc.", "Banana AG"],
    "country": ["FR", "DE", "FR"],
    "stock_price": [152.501, 99.00, 45.12],
})
print(data)
   id            name country  stock_price
0  14    Cookie Corp.      FR      152.501
1  82  Chocolate Inc.      DE       99.000
2   5       Banana AG      FR       45.120
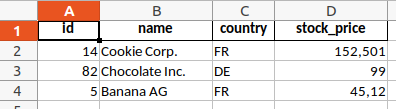
Our data contains an id, a company name, the country where the company is based and its current stock price. We can write it to an Excel file with a very simple command, the "to_excel" method for pandas data frames:
output_path = "stock_price_report.xlsx"
data.to_excel(output_path)
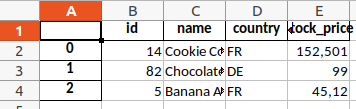
As you can see, the output includes the data frame's index in the first column, which does not provide any relevant information in our case. In addition the sheet's name is just "Sheet1", which we also want to change. We can exclude the data frame index and set the sheet name as follows:
data.to_excel(output_path, index=False, sheet_name="Company Report")
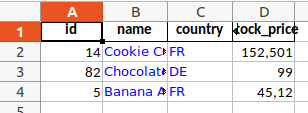
You may also want to change the column widths. Especially the name column is way to narrow. This is the right time to install the XlsxWriter package in case you haven't. It includes useful functionalities to format Excel files using Python. After installing XlsxWriter and probably restarting Python, we can turn to the column widths. To modify the columns, we first open the connection to the Excel file using pd.ExcelWriter, write the data, access the sheet, modify the column widths and then close the connection.
writer = pd.ExcelWriter(output_path)  # Open connection to Excel file
data.to_excel(writer, index=False, sheet_name="Company Report")  # Write data
sheet_report = writer.sheets["Company Report"]  # Access sheet
sheet_report.set_column(1, 1, 15)  # Modify column widths
writer.save()  # Close connection
In sheet_report.set_column(1, 1, 15), the first argument is the starting column, the second is the end column, and the third is the width for all of those column. So, in this case, we change the columns 1 to 1 to a width of 15. Since indexing starts at 0, column 1 is of course the second column, which contains the company name.
Text Formatting
In this section, you will learn how to change the colour, font, size, number format etc. of the text in a cell, and how to allow linebreaks within a cell.
To format the text in a cell, we need a dictionary with the format specifications which we pass to the Excel methods. It can look like this:
custom_format_dict = {
    "valign": "vcenter",  # center text
    "font": "PT Sans",  # custom font
    "size": "10",  # text size
    "font_color": "blue",  # text colour
}
To use this format dictionary, we first need to access the "workbook" and add our format dictionary to the list of known formats in the file. Then we apply it to our sheet.
writer = pd.ExcelWriter(output_path)
data.to_excel(writer, index=False, sheet_name="Company Report")
sheet_report = writer.sheets["Company Report"]
workbook = writer.book  # Save the workbook in a separate object
custom_format = workbook.add_format(custom_format_dict)  # Add the custom format to this workbook
sheet_report.set_column(first_col=1, last_col=2, cell_format=custom_format)  # Use the format in columns 1 to 2 of our table
writer.save()
To allow line breaks within a cell, you can use the "text_wrap" in the format dictionary, for example:
custom_format_dict = {
    "font": "PT Sans",
    "text_wrap": True,
}
You may have noticed that Cookie Corp.'s stock price has three decimal places, Chocolate Inc.'s stock price has no decimal places, and Banana AG's price has two decimal places. It would look better to display exactly two decimal places in the whole column. You can achieve that with the argument "num_format":
writer = pd.ExcelWriter(output_path)
data.to_excel(writer, index=False, sheet_name="Company Report")
sheet_report = writer.sheets["Company Report"]
workbook = writer.book
num_format = workbook.add_format({"num_format": 0x02})

sheet_report.set_column(first_col=3, last_col=3, cell_format=num_format)
writer.save()
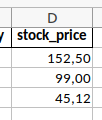
Note that Cookie Corp.'s value has not been rounded, only the displayed value has been rounded. When you click in the cell, you can see that the full information is still in the file.
You can format dates in the same way, for example using the format "yyyy-mm-dd".
Appearance of the whole table
In this section you will learn how to format the data as an Excel table, freeze the header and create a multiheader that spans multiple columns.
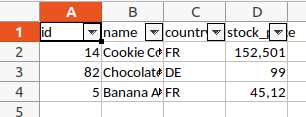
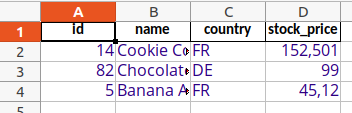
If you format the data as an Excel table, it will automatically offer the possibility to filter or sort by any column in Excel. To do this, we need to apply the add_table method to the sheet. We also need to rewrite the column names because otherwise they would be overwritten with "Column1", "Column2" and so on.
writer = pd.ExcelWriter(output_path)
data.to_excel(writer, index=False, sheet_name="Company Report")
sheet_report = writer.sheets["Company Report"]
sheet_report.add_table(
    first_row=0,  # Table begins in first row, where the column names are (no header above it)
    first_col=0,  # Table begins in first column
    last_row=data.shape[0],  # Include all the data and the row with the column names
    last_col=data.shape[1] - 1,  # Include all columns (but there are no row names or indices)
    options={"columns": [{"header": col} for col in data.columns]},  # Set the column names again
)
writer.save()
If you scroll down a very long table, the column names are not visible anymore which makes it difficult to understand the content. But you can freeze the first row(s) (or columns) of a table to solve that problem:
writer = pd.ExcelWriter(output_path)
data.to_excel(writer, index=False, sheet_name="Company Report")
sheet_report = writer.sheets["Company Report"]
sheet_report.freeze_panes(row=1, col=0)  # Freeze first row, but no columns
writer.save()
This is, of course, not necessary for our short data, but you will see the results better by scrolling down in the file you created.
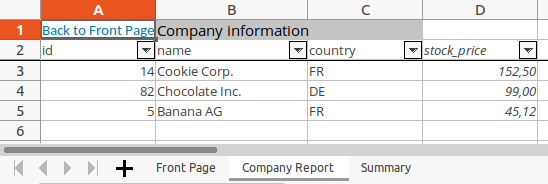
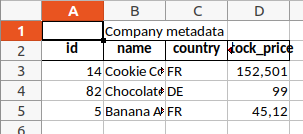
A multiheader is a cell that spans multiple cells. For example, we may want a wide cell right above "name" and "country" to label them as "Company metadata". Using the method merge_range, we merge all cells in row 0, columns 1 to 2, and fill them with the text "Company metadata":
writer = pd.ExcelWriter(output_path)
data.to_excel(writer, index=False, sheet_name="Company Report", startrow=1)  # Skip first row
sheet_report = writer.sheets["Company Report"]
sheet_report.merge_range(first_row=0, last_row=0, first_col=1, last_col=2, data="Company metadata")
writer.save()
Handling multiple sheets
In this section you will learn how to create an Excel file with multiple sheets, set a standard format for the whole file, and create links to other sheets.
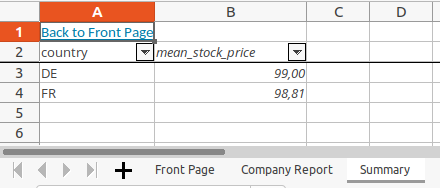
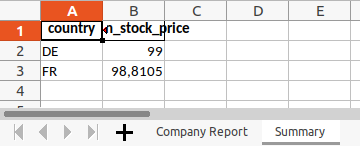
To work with multiple sheets, let's first create a second data frame. It contains the mean stock price per country:
summary = data.groupby("country", as_index=False)["stock_price"].agg("mean")
summary = summary.rename(columns={"stock_price": "mean_stock_price"})
print(summary)
  country  mean_stock_price
0      DE           99.0000
1      FR           98.8105
You actually already know everything to create two sheets in one file:
writer = pd.ExcelWriter(output_path)
data.to_excel(writer, index=False, sheet_name="Company Report")
summary.to_excel(writer, index=False, sheet_name="Summary")
writer.save()
You may not want to adapt the format of every single sheet or cell. Fortunately you can set the default font etc. for the whole document by modifying the first format in the workbook.
writer = pd.ExcelWriter(output_path,
                        datetime_format="%Y%m%d")  # Set the default date format
workbook = writer.book
workbook.formats[0].set_font("Open Sans")
workbook.formats[0].set_font_size("12")
workbook.formats[0].set_font_color("#2D0081")
data.to_excel(writer, index=False, sheet_name="Company Report")
summary.to_excel(writer, index=False, sheet_name="Summary")
writer.save()
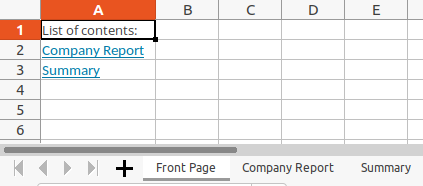
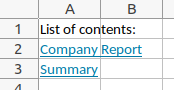
Let's now create a new sheet with a list of contents and links to all sheets. We first create a dictionary where the keys are the cells in which the links should be inserted, and the values are the sheet names we want to link:
front_link_dict = {"A2": "Company Report", "A3": "Summary"}
We first open our connection to the Excel file. Then we create our front page sheet and loop over the dictionary to write the links to the defined cells. (As you see, we don't need a pandas data frame to fill a sheet.) The link text equals the target sheet_name in our case, which does of course not have to be the case. Finally we create the remaining two sheets and save the file.
writer = pd.ExcelWriter(output_path, datetime_format="%Y%m%d")
workbook = writer.book

sheet_front_page = workbook.add_worksheet("Front Page")
sheet_front_page.write("A1", "List of contents:")
for column, sheet_name in front_link_dict.items():
    sheet_front_page.write_url(column, "internal:{}!A1:A1".format(sheet_name), string=sheet_name)

data.to_excel(writer, index=False, sheet_name="Company Report")
summary.to_excel(writer, index=False, sheet_name="Summary")
writer.save()
All together now
Let's now combine everything we did so far by packaging the functionality into reusable functions! We can also add links back to the front page and to the two data sheets, to allow the jumping back and forth feature of functionality.
import pandas as pd

# Prepare data
data = pd.DataFrame({
    "id": [14, 82, 5],
    "name": ["Cookie Corp.", "Chocolate Inc.", "Banana AG"],
    "country": ["FR", "DE", "FR"],
    "stock_price": [152.501, 99.00, 45.12],
})
summary = data.groupby("country", as_index=False)["stock_price"].agg("mean")  # Create a second data frame
summary = summary.rename(columns={"stock_price": "mean_stock_price"})

output_path = "website/blog/python_excel_reporting/report.xlsx"

# Set a default format for the whole document
writer = pd.ExcelWriter(output_path, datetime_format="%Y%m%d")
workbook = writer.book
workbook.formats[0].set_font("Open Sans")
workbook.formats[0].set_font_size("10")
workbook.formats[0].set_font_color("#3b3b3b")

# Create Front Page with list of contents
cover_link_dict = {"A2": "Company Report", "A3": "Summary"}
sheet_front_page = workbook.add_worksheet("Front Page")
sheet_front_page.write("A1", "List of contents:")
sheet_front_page.set_column(0, 0, 15)
for column, sheet_name in cover_link_dict.items():
    sheet_front_page.write_url(column, "internal:{}!A1:A1".format(sheet_name), string=sheet_name)

# Write data to multiple sheets
# Start in the second row (index 1) to leave some space for multiheaders and links
data.to_excel(writer, index=False, sheet_name="Company Report", startrow=1)
sheet_report = writer.sheets["Company Report"]
summary.to_excel(writer, index=False, sheet_name="Summary", startrow=1)
sheet_summary = writer.sheets["Summary"]


# Add links to all sheets to get back to front page
def link_to_front_page(sheet):
    """
    Put a clickable link to the Front Page to the first cell of a sheet.
    :param sheet: object of class xlsxwriter.worksheet.Worksheet
    """
    sheet.write_url("A1", "internal:{}!A1:A1".format("Front Page"), string="Back to Front Page")


link_to_front_page(sheet_report)
link_to_front_page(sheet_summary)

# Change the format of the numeric columns
custom_format_dict = {
    "font": "Open Sans",
    "italic": True,
    "font_size": 10,
    "font_color": "#3b3b3b",
    "num_format": 0x02,  # always display two decimal places
}
custom_format = workbook.add_format(custom_format_dict)
sheet_report.set_column(3, 3, cell_format=custom_format)
sheet_summary.set_column(1, 1, cell_format=custom_format)


# Format sheets as table
def format_as_table(sheet, df):
    """
    Format the data in a worksheet as table, starting in the second row
    :param sheet: object of class xlsxwriter.worksheet.Worksheet
    :param df: data frame with the original data that is in the sheet. Required to write the column names into the
      table and to determine the required table size.
    """
    sheet.add_table(
        first_row=1,
        first_col=0,
        last_row=df.shape[0],
        last_col=df.shape[1] - 1,
        options={"columns": [{"header": col} for col in df.columns]},
    )


format_as_table(sheet_report, data)
format_as_table(sheet_summary, summary)


# Change column widths
def set_column_widths(sheet, col_width_dict):
    """
    Change column widths for selected columns of a given sheet. All other columns remain unchanged.
    :param sheet: object of class xlsxwriter.worksheet.Worksheet
    :param col_width_dict: dictionary with the columns widths where the keys are the column indices and the values are
      the column widths, e.g. {0: 10, 5: 25}
    """
    for col_index, width in col_width_dict.items():
        sheet.set_column(col_index, col_index, width)


set_column_widths(sheet_report, {0: 15, 1: 20, 2: 15, 3: 15})
set_column_widths(sheet_summary, {0: 15, 1: 20})


# Freeze header in report sheet
def freeze_first_2_rows(sheet):
    """
    Freeze header (first to rows) of a sheet, such that they remain visible when scrolling down in the table.
    :param sheet: object of class xlsxwriter.worksheet.Worksheet
    """
    sheet.freeze_panes(row=2, col=0)


freeze_first_2_rows(sheet_report)
freeze_first_2_rows(sheet_summary)

# Add multiheader to report sheet
multiheader_format_dict = {
    "font": "Open Sans",
    "bg_color": "#c4c4c4",
    "valign": "vcenter",
}
multiheader_format = workbook.add_format(multiheader_format_dict)
sheet_report.merge_range(
    first_row=0,
    last_row=0,
    first_col=1,
    last_col=2,
    data="Company information",
    cell_format=multiheader_format,
)

writer.save()