White Paper: Attribution 2.0
From Simple Heuristics to Optimal, Data-Driven Models
Just a few years ago, the switch from the "Last Contact" to "Bathtub" models represented a small revolution in online marketing. But truth be told, both methods are simply heuristics, applying arbitrary rules rather than learning from the data. The next major evolutionary step is a state-of-the-art data-driven attribution model. As data-driven approaches become more popular, the number of available models is growing. Marketers looking for a suitable attribution model quickly find themselves confronted with an overwhelming number of options. It is becoming increasingly difficult to evaluate models in terms of their strengths and weaknesses, and to decide on the right model.
A quality attribution model decisively impacts the efficiency of online marketing, and is therefore central to a company's competitiveness. In order to sensibly allocate budgets, it's necessary to break down the status quo of attribution, and prepare the way for attribution 2.0. This means not only turning away from classical heuristics, but also the further development and individualization of data-driven procedures, including game-theoretical approaches, machine learning algorithms, and regression approaches.
The question of the suitable model can't be answered in general terms, as the procedures vary considerably with regard to the complexity and maintenance requirements. Which approach is best depends on budget, personnel resources, technical conditions, and analysis requirements. For a little shop with a lower budget, the change from the Bathtub model to a simple data-driven model would take a much larger share of their financial resources than it would for a larger company. This large company may have a broad online marketing strategy, and would face totally different requirements; here, a more complex model including shop-specific metrics would be worthwhile. This would enable analyses such as reliable cohort analyses with a smaller number of cases, and the rapid evaluation of new marketing partners.
The following whitepaper sheds light on data-driven attribution procedures. It deals with the basics of attribution analysis, and presents the most common approaches along with their strengths and weaknesses. The aim is to aid in the understanding of complex attribution models, and to show where developments will lead in the future.
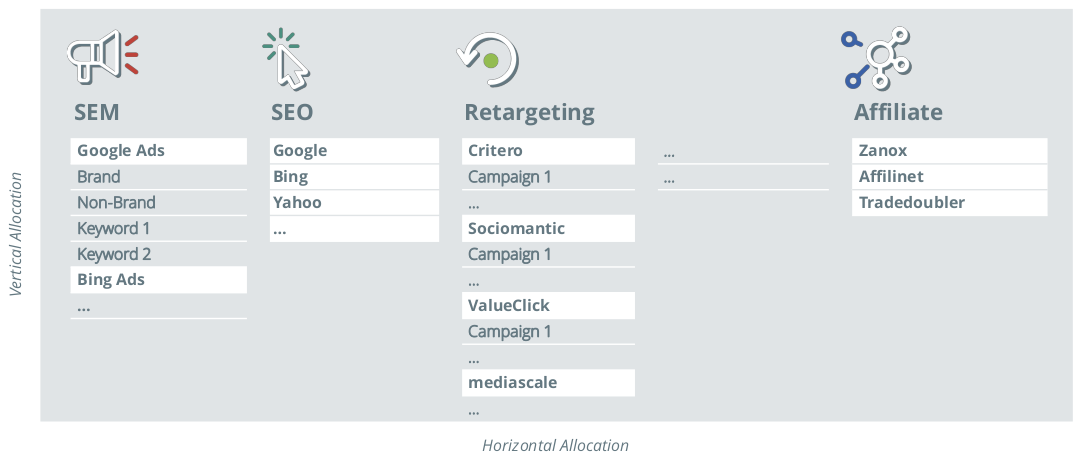 Figure 1: Horizontal versus vertical budgetary allocation
Many shops have high monthly costs for online advertising, optimizing their landing page, and augmenting their visibility. Money flows through different marketing channels, such as affiliates, newsletters, retargeting, SEM, SEO, and more. Within these channels are frequently sub-channels: for example, different providers or a distinction between brand and non-brand keywords in SEO or SEM. There are further levels of granularity, all the way down to specific campaigns and keywords. This results in a potpourri of possibilities for how to allocate an advertising budget, both "horizontally" and "vertically" (see Figure 1). The question is where to appropriate funds such that they bring the highest contribution margin or the most conversions, clicks, or views. Attribution answers exactly this question considering the current budgetary distribution.
The foundational concept of attribution is the analysis of the "customer journey". A customer journey is the trip of a user who may reach the landing page several times via diverse channels (such as through a Google search or by clicking on a banner), and at the end carries out a defined action (known as a "conversion", typically a purchase), or not. If the user converts at the end of the customer journey, it is considered successful.
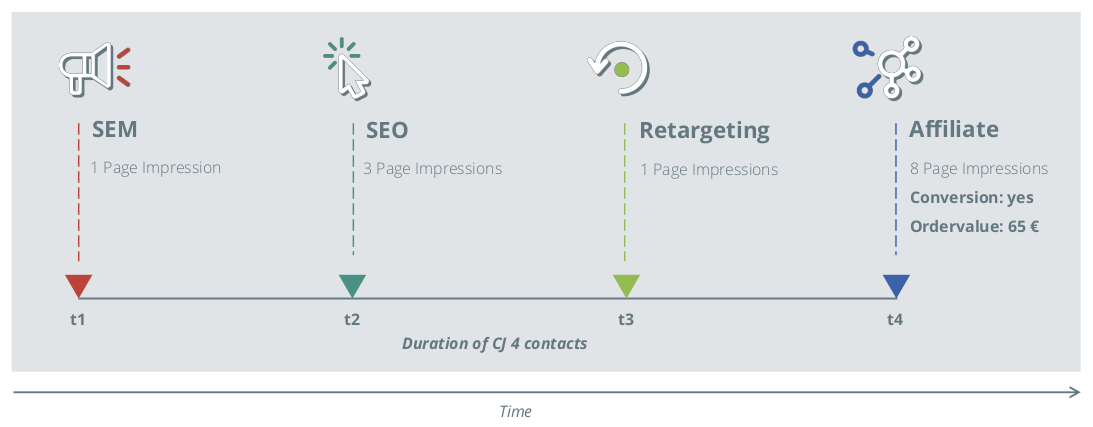 Figure 2: An example of a customer journey
An example of a customer journey is shown in Figure 2. Here, the user initially sees an advertisement matching his search query, and visits the landing page for the first time by clicking the banner. After some time the user searches for the product, and arrives to the landing page via a search engine. A few days later the user arrives to the landing page a third time, after being served a retargeting campaign ad, and then for a final time through an affiliate partner, ultimately purchasing the product. With such a customer journey, the question now becomes: which share of the individual channels are responsible for the conversion and the associated turnover (or, more precisely, the contribution margin)?
Data-driven attribution models answer this question through a model-based comparison of successful and unsuccessful customer journeys. From this, one can determine which factors are relevant for determining success. The channels involved with successful customer journeys are then attributed to their relevant contribution margins in proportion to their contribution to success. At the end of every planning period, typically on a monthly basis, budgets are optimized by allocating funds based on the attributed contribution margins of each channel/sub-channel etc. The goal is to optimally distribute the budget among the channels, and thus achieve as many conversions and the highest contribution margins possible within the given budget.
Data
Data-driven procedures learn from the data. The results of an attribution analysis can therefore only be as good as the database. Particular attention needs to be paid to the quality of the data, as problems with data quality have a direct impact on the quality and reliability of the results. Data for attribution can ordinarily include tracking data (on-site tracking), data from external partners (for example, display advertising), shopping basket data, and data from an internal data warehouse (such as customer data, order data, and product information). The data can and should explicitly consider CRM data, like new versus established customers, return visitors, and customer lifetime value.
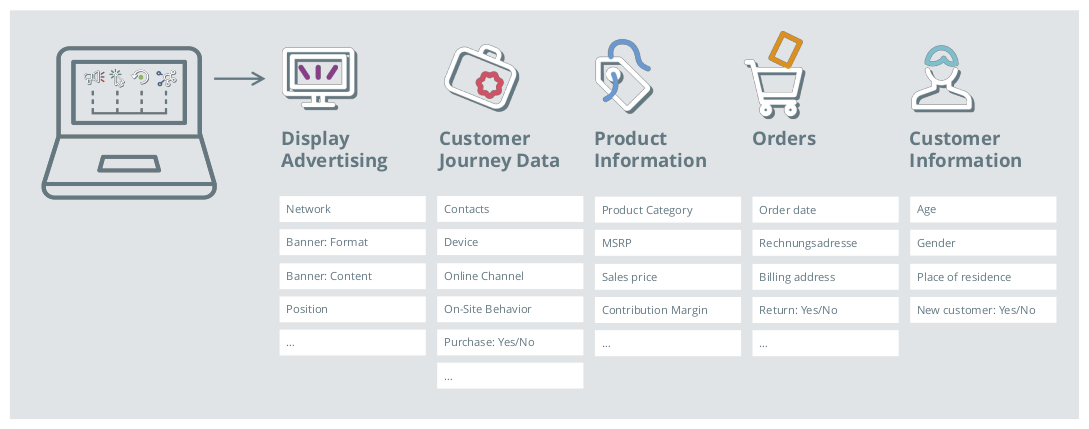 Figure 3: Many data sources can contribute to an attribution analysis
Even if many tracking service providers don't like to talk about it - in practice one should at least deal with the following points in the context of data quality assurance:
Multiple Devices
If a user changes devices multiple times during their customer journey (for example, computers at work and home, a smartphone, and a tablet), this can fragment the customer journey. The individual fragments can generally only be merged if the user is logged into an account on each device. However, this is usually only the case a purchase is made.
Deleting Cookies
In order to assign individual visits of a user (from the same device) to a customer journey, cookies are generally used in tracking. If the user deletes the cookies or has their browser configured such that it automatically discards cookies, the customer journey breaks down the tracking into sections. Although there are other methods for recognizing users (more precisely: the devices used), these are often questionable under data protection law or have serious weaknesses with highly standardized devices (e.g. iPhones).
Visibility of Banners
When display banners are used, an advertising effect can only be assumed if the banner is actually visible on the page. For example, if the banner is in the lower part of a website and the user does not scroll all the way to the end, we can exclude the banner from influencing the user's behavior. Although it is technically possible to collect this information, many advertising networks don't provide it as it can be contrary to their interests.
Missing Data on Ad Impressions
Some major advertising partners (like Google and Facebook) do not allow the tracking of impressions on banners, or only to selected certified partners. Google AdWords or Facebook dashboards then only provide aggregated data on the number of impressions and click-through rates (e.g. on the basis of placements). It is therefore not possible to determine whether individual users have seen a banner, or how they reacted to it.
Incomplete On-site Metrics
It is not possible to reliably determine the length of time spent on the last page of a session. The use of Javascript to regularly send events to the server is insufficient as a solution, since the mechanism can easily be bypassed by the user. In visits with many page views, this inadequacy of the data hardly matters. But this can be a problem in the case of a blog, for example, where users come directly to a post and no further actions take place. It's impossible to distinguish whether the user left the page immediately because the content didn't meet their expectations (known as a "bounce"), or if the article was read in entirety and the user left the page afterwards.
CRM-Data
Often CRM data can only be linked if a user is logged in. This happens regularly with successful customer journeys, specifically with a purchase. With unsuccessful customer journeys, on the other hand, only a small number of users log in, thus making it impossible to distinguish between existing customers who are not logged in, and new customers.
Maintenance of Metadata
Another pitfall lurks in the maintenance of the channel structures. If the data-driven attribution analysis is explicitly based on the channels occurring in the customer journey (like in game-theoretical approaches and lifetime models), a consistent channel designation over time is extremely important. If descriptions change (for example, if "SEM" is renamed "SEA"), this has to be taken into account in the data management upstream of attribution. This requires the complete communication of the change to all involved instances - something that is often hard to achieve in reality.
Changes to the Website
The same concept applies to fundamental changes to the landing page, or tagging of page categories (such as product catalogs, product detail pages, or help pages). While fundamental changes are typically communicated, this is often forgotten for smaller - yet possibly still relevant - changes. This is particularly true for larger shops with distributed responsibilities, and clear rules must be defined about who is to be notified of a change to the website.
The above points are by no means an exhaustive list, but rather only examples of difficulties that occur regularly. Overall, the quality of on-site and off-site data is significantly lower than that of CRM data. Since many of the problems mentioned above cannot (currently) be avoided, attribution procedures should be able to handle incorrect data. The ability of a statistical model - despite problematic data - to deliver approximately optimal results is called robustness. In relation to the reality of attribution, this property is of central importance.
Selection of the Analysis Period
Data-driven models can only ever be as good as the data on which the models were calibrated. In addition to the potential challenges listed in the previous section, the choice of the analysis period is also critical. Depending on the industry, the duration of a customer journey can vary significantly. While in some industries 90% of successful customer journeys take no more than two weeks, in other industries the decision-making process could be three to six weeks. If the period chosen for the analysis is too short, many customer journeys will be truncated at the edges of the time window because only parts of them are in the observation period. For example, customer journeys at the beginning of the time window appear too short, because previous contacts were not exported. At the other end of the analysis period there is the problem of customer journeys that are not yet completed. These may be considered unsuccessful, regardless of whether they convert shortly after the analysis. In order to reduce the share of these problematic cases, a time window of at least 12 weeks (longer if necessary) should serve as a basis for the analysis. In order to ensure the transferability of the results, it should also be ensured that no fundamental changes have been made to the structure of the marketing channels, tracking, or landing page during this period.
Data-driven Approaches
Classical heuristics like the Last Contact and Bathtub models have had their day in attribution, and have been replaced by data-driven models. In principle, the expression of a binary variable (like conversion: yes or no) is modeled. In other words, the systematic differences between successful and unsuccessful customer journeys are identified and analyzed. Thus, attribution modeling is a discrete choice problem; analyzing these differences allows for the identification of the characteristics that contribute positively to a purchase decision, and the extent to which each contact influenced the purchase. This enables the attribution of the turnover or the contribution margin.
In practice, the following procedures have been established for this purpose:
- Game-theoretical Models (Shapley-Values)
- Machine Learning Algorithms
- Statistical Regression Approaches
- Logistic Regression
- Bayesian Models
Game-theoretical Models (Shapley-Values)
The game theory models used in attribution are based on Lord Shapley's approach. Abstractly speaking, Shapley considers a coalition of players who work together towards a certain result. The approach makes it possible to determine an individual player's contribution to the result, using the marginal contribution of each player to the overall outcome (the marginal contribution of a player is the difference between the result achieved, and what would have been achieved without the player in question).
In attribution analysis, the players are the various channels involved in a customer journey, and the result is whether or not that journey was successful. The procedure only considers the channels involved in a customer journey and their sequence, though in practice the order of the channels is usually only taken into account for relatively short customer journeys (with a maximum of four to five contacts), since the number of sequence combinations for longer chains quickly becomes very large and thus numerically too complex. No further information beyond the channels is considered. Advocates of the game-theoretical approach argue that the Shapley approach has a high level of robustness, and only ever compares "similar" customer journeys with each other with regard to the channel sequence. Although this approach is more flexible in terms of channel evaluation that common regression approaches, it is incompatible with findings about the high significance of user-specific engagement metrics (see below).
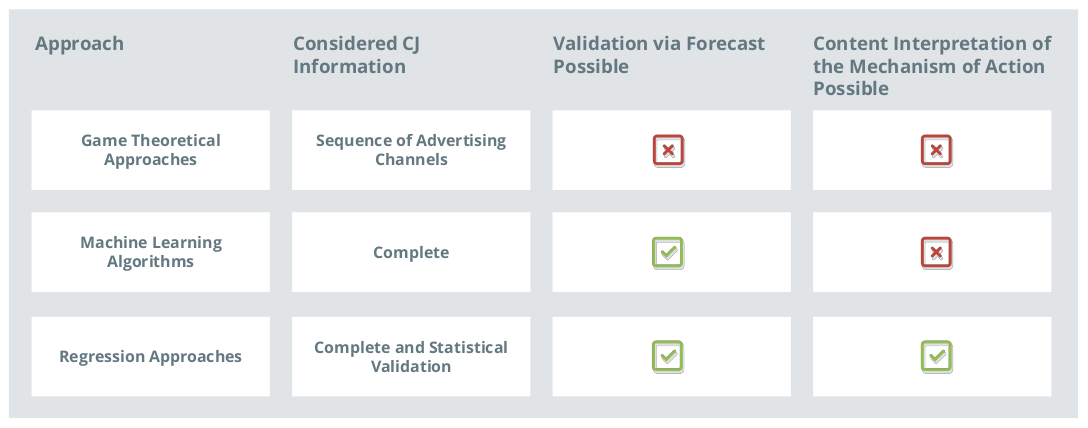 Figure 4: Comparison of data-driven attribution approaches
Machine Learning
Machine learning algorithms have their roots predominantly in computer science, where they were developed for the recognition of categories and patterns. The algorithms are typically a "black box", which doesn't allow for insights into cause-and-effect relationships between the analysis metrics and the identified categories. The optimization to the data set used for the calibration of the model carries the risk of "overfitting". This means that the rules from the training data set are perfectly mapped. If these rules are applied to new data sets and future customer journeys, the model might not be flexible enough to adapt. This can be measured by the out-of-sample quality. However, the "meaningfulness" of the rules used for classification can't be checked. This means that in online attribution, machine learning approaches have had limited applicability.
Statistical Regression Approaches
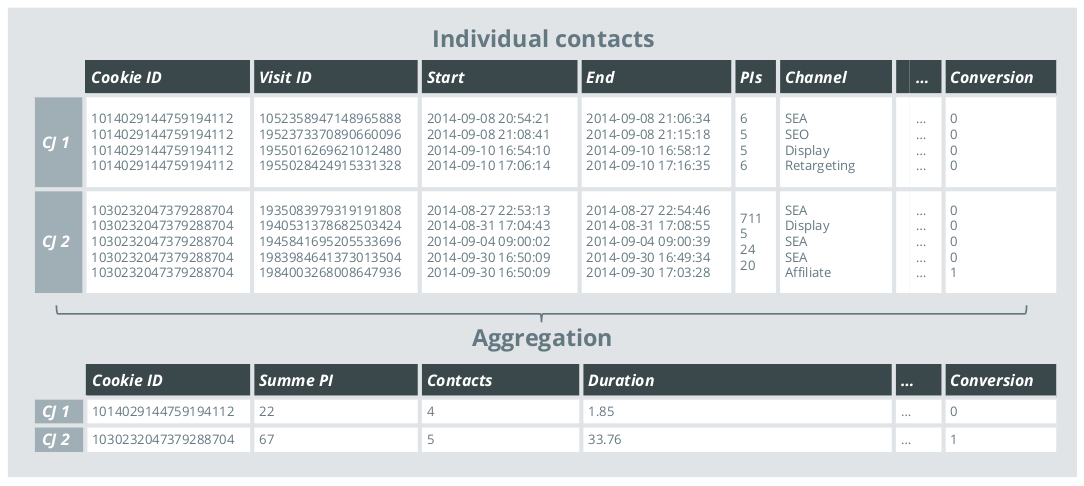 Figure 5: Aggregation of the contacts of a CJ
Statistical regression approaches in the context of attribution go far beyond multiple linear regression. Rather, they are the class of generalized linear models that comprise a flexible and proven spectrum of models that are able to describe the relationship between a dependent variable and (almost) any number of explanatory variables. Furthermore, techniques are available for variable selection, modeling non-linear relationships, and weighting and balancing of the database, and numerous quality measures exist. Within the framework of the model, hypotheses about the factors that are assumed to be influential can be tested, and causal relationships identified. Regression approaches thus open the "black box" and enable an understanding of the laws that govern conversion. For example, one could discover a correlation such as, "until a saturation range of 20 page impressions, each additional page impression increases the chance of conversion by 5%". In addition, the plausibility of the correlations can be checked and clearly interpreted.
Logistic Regression
In logistic regression, the occurrence of an event or not (a binary dependent variable) is modeled by explanatory variables. In an attribution analysis, the event would be a successful or unsuccessful completed customer journey, and would be explained by metrics such as the user's on-site behavior (time spent on the site, page impressions, etc.), the number of contacts made, the channels observed in the customer journey, and other variables. A disadvantage of attribution modeling based on logistic regression is that conversion can only be observed at the customer journey level. This means that within the model, metrics that exist at the level of individual contacts (like the number of page views per session) must be aggregated across all contacts of the customer journey. For example, the measure might be the sum, arithmetic mean, or maximum of all the observed values.
Bayesian Models
Bayesian models, rather than being their own class of models, are rather an extension of existing regression approaches with a Bayesian component. The Bayesian approach allows one to include "prior knowledge" in the model, in addition to the data. They are particularly useful where case numbers are scarce (though this is rare, at least for websites with high traffic), or in complex models with many influencing factors. However, it should always be noted that the preliminary information used must be critically checked for plausibility: if it is not consistent, the model delivers falsified results.
Comparison of the Approaches
The data-driven approaches can be compared by answering three key questions:
- Which part of the information contained in the customer journey data can be considered for the attribution analysis?
- Is it possible to validate the model within the framework of a forecast?
- Does the model allow for the identification of the effect mechanisms, and thus promote a detailed understanding of purchase decisions?
Information Used
The amount of information used by the model in the game theory approach is small in comparison to what is used in the machine learning and regression approaches; only the concrete sequence of advertising channels in the customer journey is taken into account. Other metrics such as users' on-site behavior are not included in the calculation of the Shapley Value. As a result, the contribution of a contact to a successful purchase is assessed identically, regardless of whether the user was intensively involved with the contact (such as a long stay or many page impressions), or not.
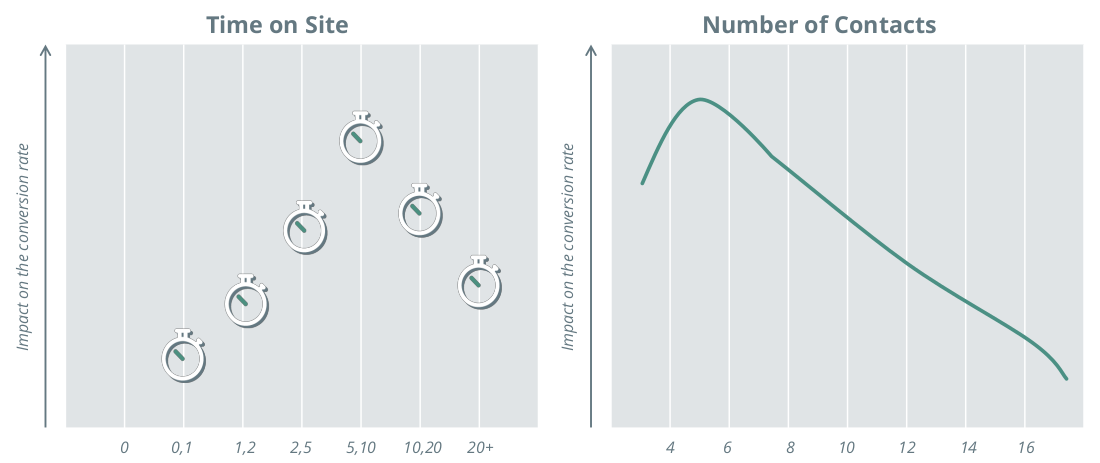 Figure 6: The impact of time spent on the website on the conversion rate
In practice, however, these metrics are very meaningful, as interested users are more likely to buy than those who show little intrinsic buying interest. Since this assumption is based on basic consumer behavior, the models based on it are very stable in practice. Analyses show, for example, that this correlation applies even during the holiday season with higher advertising costs and consumer demand. The ability to consider more than just channel information is therefore a clear advantage of machine learning algorithms and regression approaches.
However, it should be noted that in all procedures where a complete customer journey is the unit of analysis, an aggregation of the contacts of the customer journey must always be carried out upstream of the analysis, inevitably involving a loss of information (as shown in Figure 5).
Machine learning algorithms and regression approaches also have to cope with this challenge. It is important to note that due to their statistical nature, regression approaches also offer the possibility to determine the significance of the considered variables and statistically control their selection.
Model Validation
The actual attribution problem is that the contributions of the individual contacts to the successful outcome of the customer journey are not directly measurable. Thus, the question arises as to what extent theoretically-motivated attribution concepts can be practically validated.
Since machine learning algorithms and regression approaches are based on modeling cause-and-effect relationships between a target and customer journey data, future purchase decisions can be predicted. A reliable measure of the quality of these methods is therefore the ability to correctly predict future purchases.
Regression approaches are adapted to the particular shop-set standards and achieve an AUC (Area Under the Curve) of 0.75 to 0.85¹. This not only confirms the identified causal relationships, but also underlines the potential for these methods in the area of predictive analytics (see below).
¹If - analogous to the game-theoretical concept - there is a restriction to the use of channel information in the modelling, the prediction quality of the regression methods decreases by more than 40%. This means that the additional metrics considered in the regression model are extremely relevant for the modeling of the purchase decision and the attribution - if the focus is on the model quality - should not be based exclusively on the sequence of the channels.
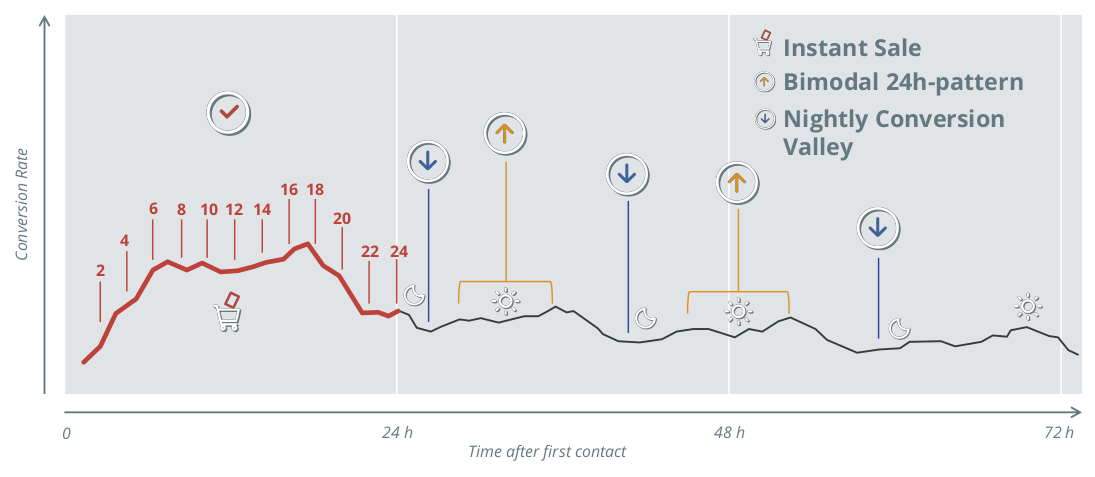 Figure 7: Conversion rate depending on the time of day after the first contact
Contextual Interpretation of the Effect Mechanism
The game-theoretical approach uses a fixed calculation to quantify the marginal contributions of individual channels to a successful purchase. As a result, no further insights into the purchase decision process can be gained within the framework of this approach.
Machine learning approaches, on the other hand, are often black boxes as a result of their development history. They identify connections between explanatory and dependent variables, but their parameters can't be interpreted in terms of content (as is the case with neural networks) or are very difficult to interpret (like with random forests).
Regression models, on the other hand, have the advantage that the identified cause-and-effect relationships can be described and verified in the form of directly-interpretable coefficients and their associated information on statistical reliability.
The panel on the left of Figure 6 shows an example of the quantified influence of "time spent on the site" on the probability of a successful customer journey, ending with a purchase: sessions of five to 10 minutes result in a higher probability of purchase, which decreases as the session length goes beyond that. The panel on the right displays an example where a medium number of contacts is optimal in terms of purchase probability, whereas longer chains indicate undecided customers.
Attribution 2.0
What is the perspective for the further development of attribution modeling?
Survival models, a variation from the field of statistical regression approaches, have great potential. They combine the robustness and interpretability inherent in regression with the ability to use data directly at the level of individual contacts. This eliminates the need for aggregation, and thus the major disadvantage of modeling using logistic regression. Such models also have the ability to consider the channel sequence, like in game-theoretical approaches, improving model quality.
Survival models originate from biometrics, where the time until the occurrence of a certain event (often death in clinical statistics) is analyzed. This can be directly applied to the customer journey framework. The model simply uses the information that no conversion has taken place up to a certain point in time, which also overcomes the problem of truncated customer journeys in a short analysis period. Since biometric methods - which are regularly used for the approval of drugs and the evaluation of the efficacy of therapies - are subject to the highest methodological demands, survival models are regarded as very well tested and reliable.
The central parameter of lifetime analysis in attribution is the time-resolved conversion rate. During modeling, the system determines the extent to which the history of the customer journey (that is, the contacts that took place up to a certain point in time and their properties) influences the conversion rate. The information on each individual advertising contact is taken into account in the model, and aggregation across all customer journey contacts is not required (see above). The information can be both the channel information of each contact (analogous to the game-theoretical approach) and any other metrics (such as engagement or view contacts). The survival approach can also be used to forecast future buying behavior, and thus model quality can be assessed out-of-sample. The estimated causal relationships and their plausibility can be checked within the framework of content interpretation.
A typical task for lifetime analysis is modeling purchase probability as a function of the time of day at which the first contact took place. At the same time, the influence of the time since the first contact on the purchase probability is also of interest. The survival approach makes it possible to identify and visualize the interaction between the two variables with regard to their effect on the purchase probability, thus enabling more differentiated statements.
First, a clear pattern can be seen for customer journeys that begin during the day: the successful conclusion is most likely right after the first contact, and one observes an instant sale. If the customer journey is not completed in time, the purchase probability decreases, and is lowest in the night hours (nocturnal conversion valley). An increased conversion rate is recorded every 24 hours.
Customer journeys where the first contact takes place at night have a very different pattern: after a relatively short time there is an increased willingness to buy the next morning, as well as late the following night. The clear pattern of the nocturnal valleys is broken, and rather resembles a bimodal 24 hour pattern. This knowledge can be useful for the individual temporal control of display insertions in real-time bidding (RTB), and promises potential savings in comparison to blanket time-based rules (like, "no advertising between midnight and 7:00am").
Figure 8 shows an example of how the results obtained in a survival analysis are taken into account when attributing sales, and the contribution of the various contacts to the successful conclusion of the customer journey. In addition, the different weighting of the influencing factors is shown for each contact.
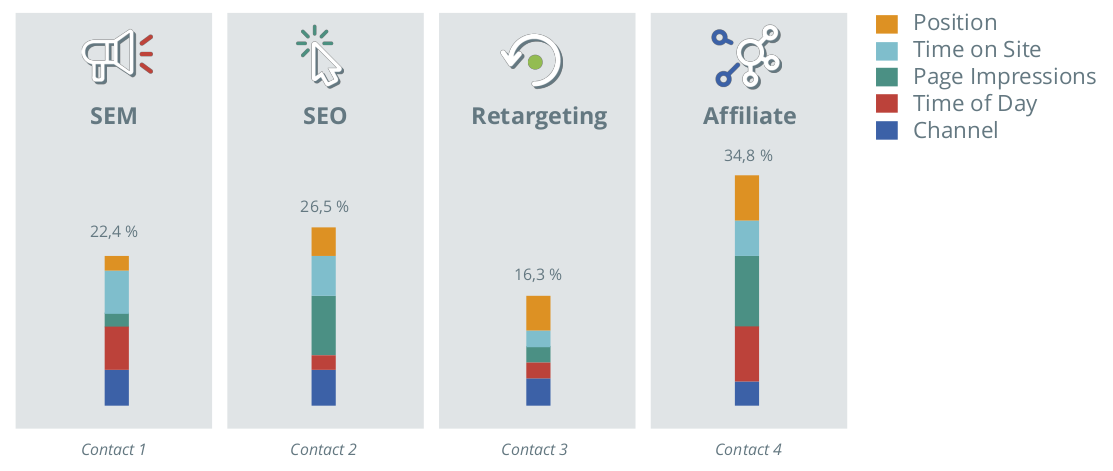 Figure 8: Contribution of the various contacts to the successful CJ
Conclusion and Outlook
Attribution analysis forms the basis of an efficient online marketing strategy, and directly influences business results. The heuristic attribution models that are still being used by some companies are no longer up to date, and the move towards a data-driven, dynamic model is essential. The decision about which of the models presented above is the best one to use is of secondary importance: at the channel level (horizontal allocation), the differences between the procedures are usually small, with typical deviations no more than +/- 5%. Only when the requirements are more specific (for example, when reliable results are needed even in small subgroups, perhaps at short notice when evaluating a new banner), the model quality becomes more important. More recent developments show that approaches can be optimized with shop-specific extensions, especially for models from the regression family of approaches. In individual cases, it is also necessary to decide at which point optimization makes sense in the context of budgeting.
The survival model is a data-driven approach that avoids the need for information loss through aggregation. The channel information of each contact can be used, leveraging the strength of the game-theoretical approach, as well as any other metrics, in the context of regression modeling.
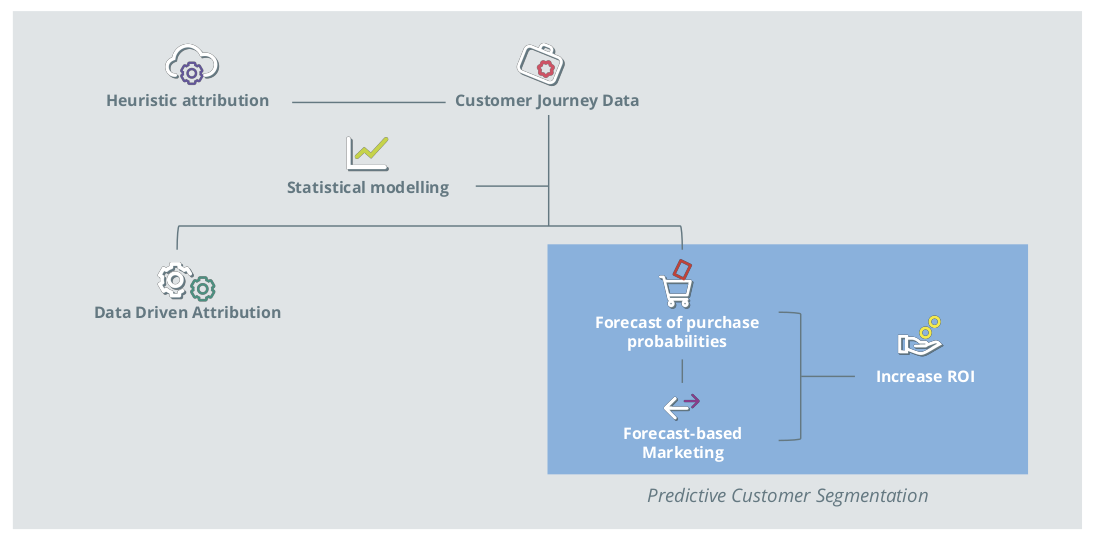 Figure 9: Potential of using CJ data