Business Case: Customized stack for automated air pollutant forecasting in Berlin
Task
Air pollutants have a direct detrimental effect on human health, causing respiratory problems and cardiovascular diseases, for example. For this reason, the Berlin Senate Department for Mobility, Transport, Climate Protection and the Environment (SenMVKU) would like to provide the citizens with reliable information on air pollutant concentrations and limit value exceedances. To do this, it needs a forecasting model. The model forecasts give people the opportunity to avoid areas with high levels of air pollution and, for example, to move their jogging routes from the street to the park. It also enables the Senate Administration to estimate a few days in advance how much traffic is compatible with health and, if necessary, to introduce traffic management measures to reduce pollution.
The contract includes a spatial and temporal air pollution forecast for the pollutants nitrogen dioxide and particulate matter in two different particle sizes. Similar to a weather forecast, forecasts are required for the next four days at hourly intervals for all major streets in Berlin. The forecasting process should be fully automatic and robust, even in the event of irregularities in data provision or missing data.
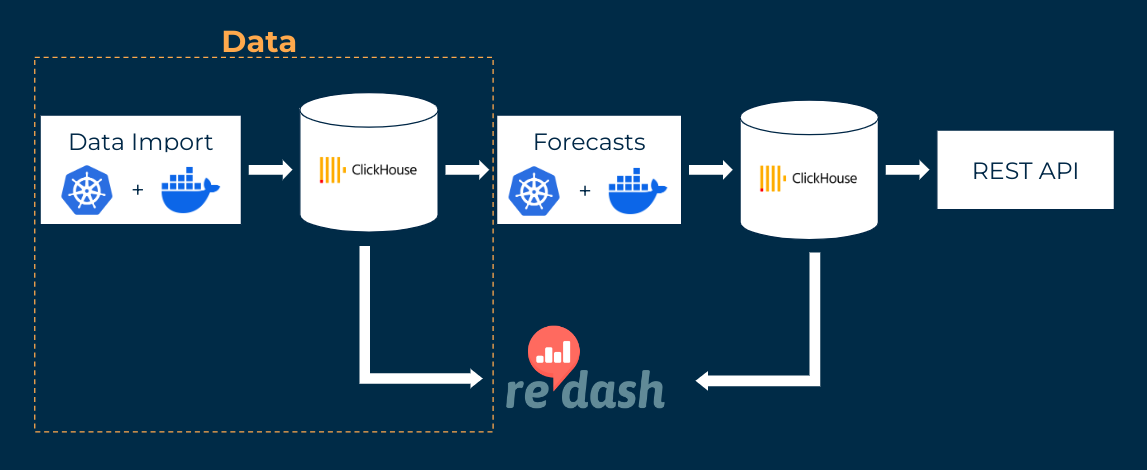
Data
The most important source of data is the measured values of nitrogen dioxide and particulate matter at the 17 air pollutant measurement containers in Berlin since 2015. These containers are located in very different places, from busy roads to residential areas and forests. Another data source is the weather forecast of the German Weather Service (DWD). The data interfaces (APIs) for pollutant measurements and weather forecasts are updated hourly. In addition to the weather forecast, there is also a large-scale air pollutant forecast from the Copernicus consortium, which shows the background pollution levels, such as those observed on the outskirts of cities. The Copernicus data is updated once a day during the morning.
Traffic is one of the main drivers of pollution in Berlin. High-resolution counting data from over 200 traffic detectors throughout Berlin serve as the basis for a forecast of expected traffic.
In order to make a forecast for locations where there is no measuring container, information about the locations is required, for example about the building density and green space as well as the general traffic volume from traffic counts. In order to make forecasts for all sections of major roads, information on all roads in Berlin is also available.
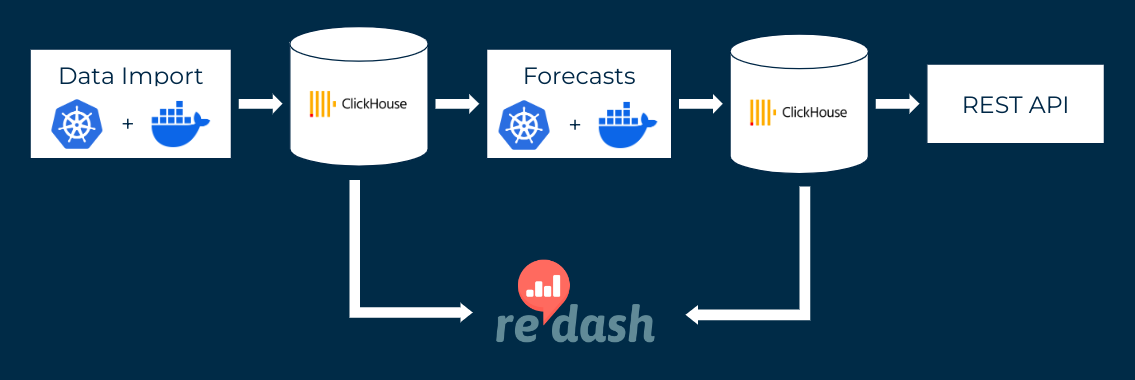
The regular data imports are implemented using jobs that are controlled via Kubernetes. These jobs execute Python or R program code that reads in the data, fills missing data with plausible values, converts the data into a uniform format (e.g. with regard to temporal and spatial resolution) and saves it in a database. This is a ClickHouse database, which is particularly efficient when dealing with large amounts of data.
Dashboards from the open source software Redash are used to validate the data. Redash accesses the ClickHouse database directly for this purpose. In addition, various alarms are set up in Redash to send notifications in the event of problems, e.g. late data deliveries or major missing data.
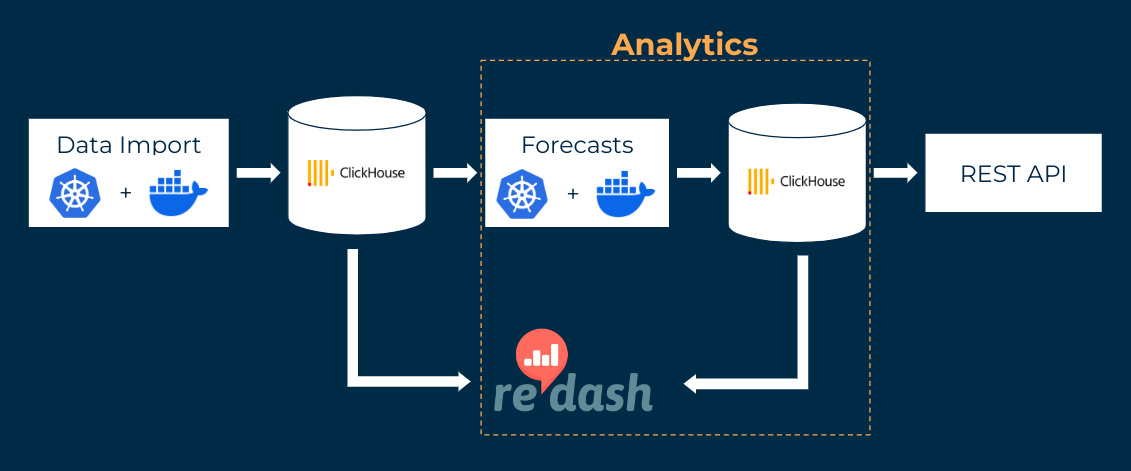
Analytics
An XGBoost model, a machine learning approach, is used to forecast air pollution levels for the next four days. This algorithm can extract non-linear effects and complex interactions from the data and use them for the forecast. For example, the model learns:
- The stronger the wind, the lower the pollution level. However, particulate pollution increases again in extremely strong winds. This initially surprising correlation was confirmed by the Senate Administration and is presumably due to turbulence.
- Pollution levels are higher during rush hour, with the peak in the morning being shorter and stronger than in the evening. These peaks can only be observed on working days.
- Particulate matter pollution is highest in easterly winds and lowest in northerly winds. This is due to the fact that little particulate matter is brought in from the direction of the sea (north). The regions to the east of Berlin are where most of the industry that produces particulate matter is located.
In the first step, forecasts are created on a 50x50m² grid throughout Berlin. In the second step, these are aggregated to the streets using the detailed street network.
New model forecasts are created several times a day based on the latest data, also using Kubernetes jobs. These execute a Python code that feeds the consolidated data from the database into a pre-trained model. The forecasts are stored in a production database.
Correlations in the data can change over time. For example, the increase in the proportion of electric cars can lead to a lower impact of traffic on pollution levels. In order to depict the current correlation structure in the model, the model is regularly retrained with a monthly Kubernetes job.
Redash dashboards enable the models to be evaluated and monitored.
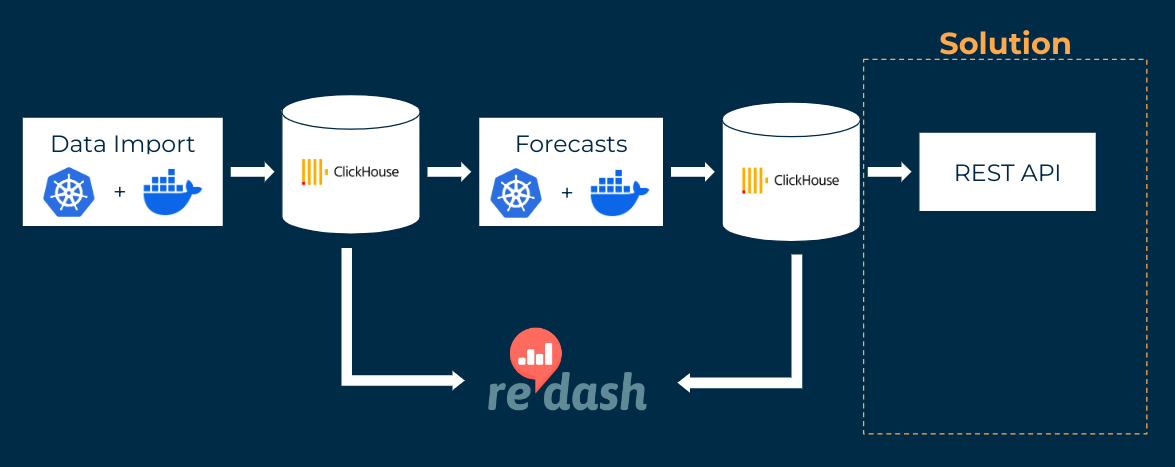
Solution
A complex infrastructure is required to ensure that the necessary forecasts for all pollutants are generated regularly and reliably. The custom stack used also ensures maximum stability from a technical perspective: If a Kubernetes job aborts, it is automatically restarted until a maximum number of attempts has been exceeded. Temporary problems, for example with the database connection, therefore require no manual intervention. The Kubernetes jobs always run the R and Python code in Docker containers. This generates a stable software environment in which the versions of all programs and libraries used are fixed. This prevents automatic version updates from leading to errors. When manually installing updates or making changes to the code, automated tests ensure that the code continues to function as expected. By strictly separating the development and production environments, new developments are first extensively tested for functionality before they are released to the public and SenMVKU in the production environment.
The latest forecasts are made available via a publicly available interface (REST API).
By providing this customized software solution, air pollution forecasts are reliably and regularly generated. The latest available data is continuously integrated and minor problems are automatically corrected. The forecasts are made available to the public and other service providers via the API, for example for the creation of visualizations.