Best Practice in TV Tracking: Why a Simple Baseline Correction Falls Short!
Best Practice: TV Tracking
"With an eye on the future, there are a couple of measures which could be taken in order to obtain a complete picture of TV advertising as a marketing channel." write the authors of a recent contribution on the topic of TV tracking and the consideration of short-term TV-induced online traffic in attribution. The article by Lisa Quetting and Evgeniya Anikina can be found on the tech blog of the e-commerce company Project A from Berlin. The authors explain the approaches and concepts currently used in online marketing practice, and discuss worthwhile extensions of the status quo. Since we have already implemented some of these extensions in customer projects, we would also like to bring our experience and results into the discussion.
The Common Concept: Baseline Correction
The common approach of baseline subtraction to measure additional TV-induced on-site traffic presumes the following scenario:
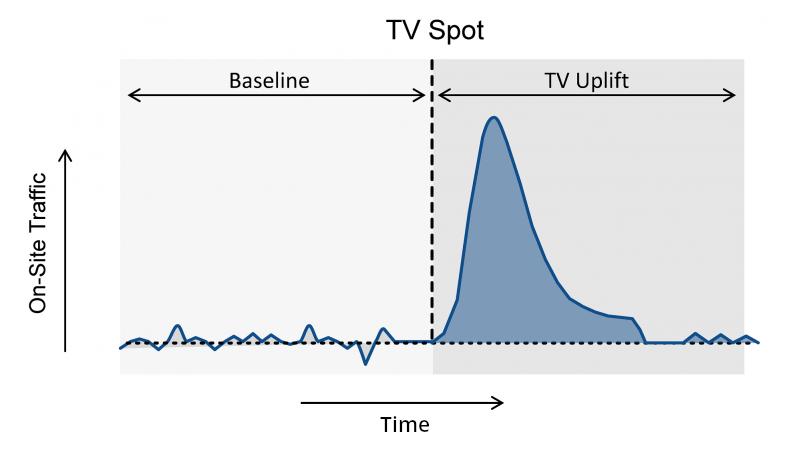
Before broadcasting the TV spot, the level of the usual on-site traffic can be determined, so that the additional traffic exceeding this level can be interpreted and quantified as a short-term TV uplift after the spot has been broadcasted.
In Which Situations Does the Simple Measuring Concept Distort the Results?
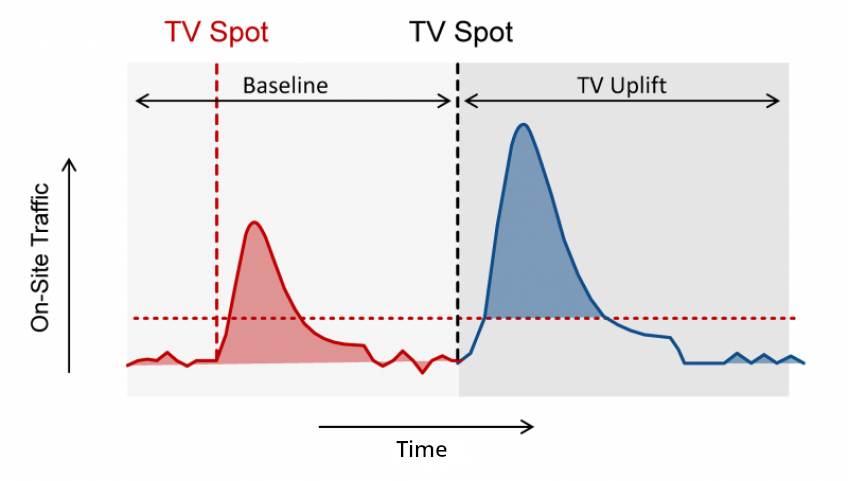
If several TV spots are broadcasted temporally close together, the uplifts measured by means of baseline subtraction are falsified. If, for example, an additional spot-induced uplift falls in the timeframe envisaged for the baseline determination, the baseline will be overestimated, and the uplift of the spot following will be underestimated.
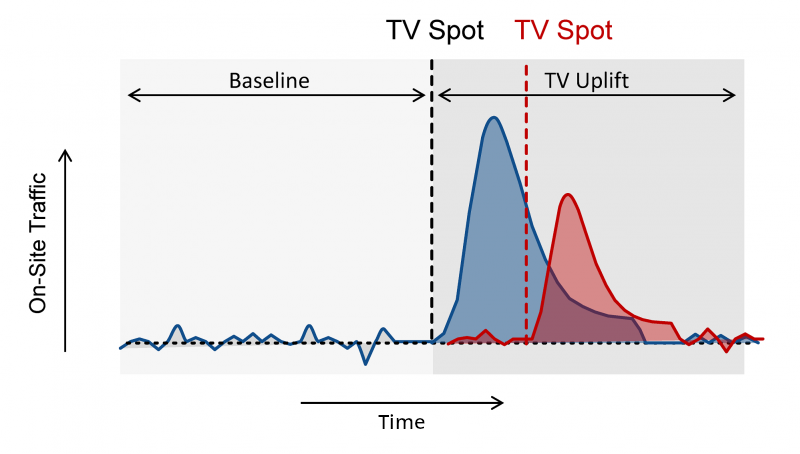
Also critical is the temporal overlay of the uplift of two spots, since here the contributions of the two spots can not be separated in time.
Another challenge for the determination of the spot-specific uplift occurs when advertising is broadcasted on different TV stations at the same time. The uplift observed after the broadcast can no longer easily be assigned to the responsible spot.

Occasionally it is proposed to solve the last two problems by using the information on the reach of the spots involved. In concrete terms, the uplift that cannot clearly be assigned to a certain spot is assigned in the ratio of the reach of each spot. However, our statistical analyses show that the observed uplift of non-overlapping spots can only be explained to a small extent (approximately 20% to 25%) by the spot reaches, so such a solution can by no means be regarded as optimal.
Are the Possible Measurement Errors of the Simple Baseline Subtraction Relevant in Practice?
The extent to which the problems outlined are relevant depends on two factors: the duration of the induced TV uplift and the time interval between the broadcasted TV spots. When we look at the customer projects we serve, the uplift typically spans 5 to 15 minutes. 50% to 70% of the emitted spots are broadcasted in a time interval of less than 10 minutes. This means that for more than half of the spots emitted - using the simple baseline correction - falsified uplifts would have been calculated.
Are the Measurement Errors Avoidable by More Complex Methods?
In order to avoid incorrect conclusions in downstream analyses on the TV advertising impact, it is necessary to use reliable solutions to the problems highlighted and to implement concepts that go beyond the simple baseline subtraction. An undistorted quantification of the TV impact can be ensured by using a multi-level statistical procedure:
- Step 1 - Identification of Relevant Online Channels: Before the actual analysis, the online channels that show statistically significant TV-induced traffic are identified. This upstream step makes it unnecessary to determine the extent to which individual channels are relevant for TV analysis at all. This question will be answered on the basis of the data collected.
- Step 2 - Undistorted Baseline Measurement: The baseline is modeled in the context of a multiple regression, taking into account possible upstream TV uplifts so that the baseline can be determined separately from the TV-induced traffic and used as undistorted measure in the subsequent analysis steps.
- Step 3 - Uplift Shape Analysis: The undistorted separation of baseline and TV-induced traffic from step 2 allows the systematic timing and duration of the TV uplift separately for each online channel and the restriction to significant time periods for further analysis.
- Step 4 - Shape Pattern Recognition: The baseline corrected TV uplift time series is the basis for Shape Pattern Pattern Recognition, which allows the correct decomposition of overlapping TV uplifts into the contribution of each spot.
- Step 5 - Predictive Impact Modeling: The techniques used in steps 1 to 4 are based on the temporal separation of the TV advertisement broadcasts. This separation is, in the case of spots emitted at the same time on different TV channels, no longer possible. However, a comprehensive statistical modeling of the already-identified uplift offers the possibility to make a forecast for the uplift of the spots on the basis of the specifics of the simultaneously emitted spots, and to use them for the further analysis. Since such a comprehensive modeling takes into account not only the spot reaches (see above), but also saturation effects, TV channels, times, days of the week, etc., the explanatory power of the models increase to 70% or even 80%, so that the confidence in the forecast is justified from a statistical point of view.
What Does the Result of a Correspondingly Comprehensive Analysis Look Like?
The result of such a comprehensive statistical analysis can be visualized as a breakdown of time-resolved on-site traffic into a baseline and TV component. From a statistical point of view, it is first of all interesting how high the explanatory content of the model is, i.e. what proportion of the variation of on-site traffic can be explained by baseline and TV uplift. In our analyses, values for the explanatory power of 85% and more are quite common, which makes it clear that the outlined approach is suitable for measuring the TV effect with the utmost reliability.
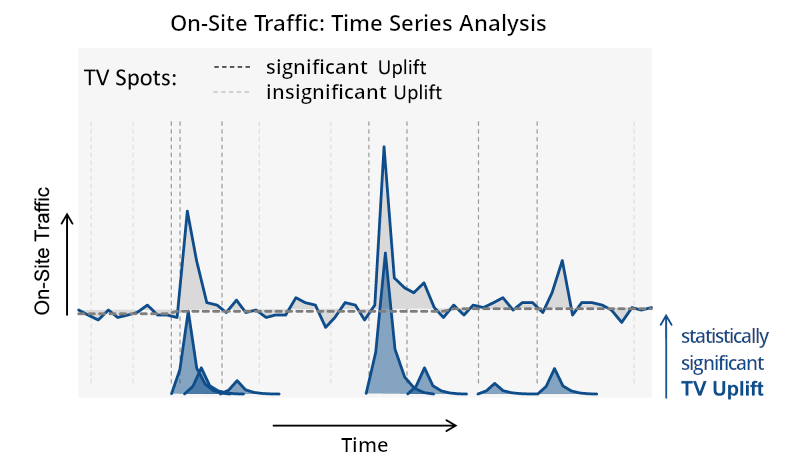
Among the results of this measurement is information as to whether an increase in traffic after broadcasting a TV spot can be considered a random fluctuation or a statistically significant uplift. For TV spots with a significant uplift, the contribution to the traffic is also identified when the uplift is overlapped and clearly assigned to the spots involved.
How to Use the Results for the Analysis of the TV Advertising Impact?
Firstly, the additional traffic induced by the individual spots can be set in relation to the costs for broadcasting the spots. This is done on the basis of the modeling results, and allows for a comparison of the slots with each other. In order to take into account the additional revenues generated by the short-term TV uplift in a cost-benefit ratio, the TV uplift must be considered in the attribution and TV must be identified as an additional advertising channel in the attribution result. This is done by determining the two relevant attribution shares:
- For each user, the prevailing TV ratio at the time of his website visit is determined, i.e. the probability that it is TV-induced traffic. For online channels without significant TV uplift, this ratio is always 0. (This approach is necessary because although the TV uplift is determined on an aggregated scale, the individual TV traffic can not be separated from the individual baseline traffic).
- For every successful customer journey, the proportional impact of the individual contact points (website visits) is calculated for the purchase decision.
The sales attributed to the TV spot by the combination of the two shares (or contribution margins) allow the calculation of the contribution of the TV spot to the individual sales. Thus, by aggregating all sales, the spot-specific short-term attribution share can be determined. This approach takes into account TV's contribution not only to the sale contact, but also as the initiator of a customer journey and in the assist area of the chain.
Conclusion
The presented approach robustifies the error-prone baseline approach, and thus avoids the potential measurement errors in the simple baseline subtraction. It also enables advertisers to break down changes in on-site traffic into statistically significant TV uplift and random fluctuations. This means that all further cost-benefit analyses can be carried out on a statistically valid basis.